Patch Management at Scale: How to Update Windows and Linux Without Breaking Production

Patch Management at Scale: How to Update Windows and Linux Without Breaking Production

Patching is one of the highest ROI security controls—yet it’s also one of the fastest ways to break production if done poorly.

In mixed environments (Windows + Linux + cloud + on‑prem), patching often becomes:

  • a monthly fire drill,

  • a spreadsheet-driven process,

  • or “we’ll do it later” until an incident forces your hand.

This article outlines a practical patch management approach you can roll out in real infrastructure: predictable, auditable, and designed to minimize downtime.


Why Patch Management Fails in Real Ops

Inconsistent inventories

If you can’t answer “what systems exist?”, patching becomes guesswork. Shadow VMs, old endpoints, and forgotten servers create blind spots.

Unclear ownership

“Who owns this server?” is a common patch blocker. Without service ownership, patching stalls.

One-size-fits-all windows

Patching “everything on Sunday night” ignores business criticality and dependencies.

No verification loop

Many teams patch, reboot, and move on—without validating service health, kernel versions, or application behavior.


Patch Management Goals (What “Good” Looks Like)

A mature patch program should deliver:

Predictability

  • Fixed cadence for routine updates

  • Defined emergency process for critical CVEs

Risk-based prioritization

  • Critical internet-facing systems patched first

  • Lower-risk systems batched later

Minimal disruption

  • Rolling updates

  • Maintenance windows aligned to service needs

  • Automated prechecks/postchecks

Evidence and auditability

  • Patch status reporting

  • Change tracking

  • Exception handling with expiry dates


Step 1: Build a Reliable Asset Inventory

What to capture

  • Hostname, IP, OS/version, kernel/build

  • Environment (dev/stage/prod)

  • Criticality tier (1–4)

  • Owner/team and service name

  • Patch group (e.g., “prod-web-rolling”)

Practical sources

  • AD + SCCM/Intune (Windows)

  • CMDB (if accurate)

  • Cloud APIs (AWS/GCP/Azure inventory)

  • Linux tools (e.g., osquery, landscape, spacewalk equivalents)

  • Monitoring/EDR platforms (often best truth source)


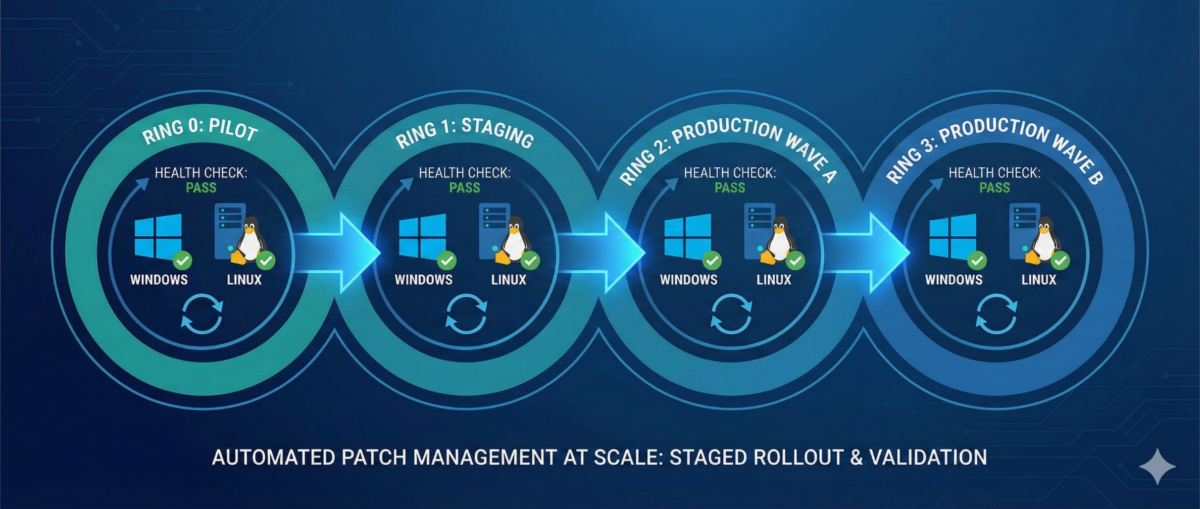
Step 2: Define Patch Rings and Maintenance Policies

Patch rings reduce blast radius.

Example ring model

Ring 0 — Lab/Canary

  • First patch landing zone

  • Includes representative app stacks

Ring 1 — Low-risk production

  • Internal services, non-customer-facing nodes

Ring 2 — Core production

  • Customer-facing workloads with rolling capability

Ring 3 — Critical/Stateful

  • Databases, domain controllers, cluster control planes

  • Heavier change control, deeper validation

Service-based maintenance windows

Instead of one global window:

  • align patching to service usage patterns,

  • and use rolling updates where possible.


Step 3: Standardize on Tooling Per Platform

Windows (common patterns)

  • Intune / WSUS / SCCM / Windows Update for Business

  • GPO for policy enforcement

  • Maintenance windows tied to device groups

Key practices:

  • staged deployments (rings)

  • automatic reboots only in controlled windows

  • reporting for “installed vs pending reboot”

Linux (common patterns)

  • configuration management (Ansible/Salt/Puppet/Chef)

  • distro-native repos + internal mirrors

  • unattended-upgrades (carefully) for low-risk groups

Key practices:

  • pin critical packages if required

  • kernel update strategy (reboot coordination)

  • consistent repo configuration


Step 4: Automate Prechecks and Postchecks

This is where patching becomes safe.

Prechecks (before patching)

  • disk space and inode availability

  • pending package locks / broken deps

  • snapshot/backup status (where applicable)

  • service health baseline (CPU/mem, error rates)

  • cluster state (no degraded nodes)

Postchecks (after patching)

  • OS build / kernel version updated

  • reboot completed and uptime as expected

  • service is healthy (HTTP checks, synthetic tests)

  • logs show no startup failures

  • monitoring confirms normal KPIs


Step 5: Reboot Strategy Without Downtime

Stateless tiers: rolling restarts

  • drain one node at a time

  • patch + reboot

  • verify health

  • re-add to pool

  • proceed to next node

Stateful tiers: controlled approaches

  • leverage replication/failover where possible

  • patch secondaries first

  • promote/demote intentionally

  • schedule longer windows and validate data integrity


Step 6: Handling Critical CVEs (Out-of-Band)

When a critical CVE drops:

  1. Identify affected assets quickly (inventory is everything)

  2. Prioritize internet-facing and high-privilege systems

  3. Patch canary first (short validation)

  4. Roll through rings with accelerated windows

  5. Document exceptions with deadlines


Step 7: Reporting, Exceptions, and Compliance

Metrics worth tracking

  • Patch compliance % by ring and environment

  • Mean time to patch (MTTP) for critical CVEs

  • Reboot compliance

  • of exceptions and time-to-expiry

Exception policy (must-have)

If a system can’t be patched:

  • require risk acceptance approval

  • define compensating controls (WAF, isolation, hardening)

  • set an expiry date (no “forever exceptions”)


Conclusion

Patch management isn’t “install updates.”
It’s a repeatable operational system:

  • inventory → rings → controlled rollout

  • automation → verification → reporting

  • exceptions with deadlines, not excuses

If you run Windows and Linux at scale, patching can be both fast and safe—but only when it’s treated like an engineered process.

Zero Trust SSH: Hardening Linux Access Without Breaking Operations

Zero Trust SSH: Hardening Linux Access Without Breaking Operations

SSH is still the backbone of Linux operations—incident response, patching, break-glass access, automation, and day-to-day administration. But in many environments, SSH access is treated as a binary switch: either “you can log in” or “you can’t.” That model doesn’t scale in modern organizations where identities change, devices roam, and the blast radius of compromised credentials is massive.

A “Zero Trust” approach to SSH doesn’t mean you stop using SSH. It means you stop trusting networks, long-lived keys, and static access by default—and start validating identity, device posture, intent, and session context every time.

This guide shows a practical hardening path you can roll out incrementally—without crippling your on-call team or breaking automation.


What “Zero Trust” Means for SSH

In practice, Zero Trust SSH is built on four principles:

1) Strong identity over static credentials

Prefer short-lived credentials tied to a real identity and centralized policy.

2) Least privilege by default

Access is constrained to the minimum commands, hosts, time windows, and environments.

3) Continuous verification

Authentication is necessary, but not sufficient—authorization, posture, and session behavior matter too.

4) Auditability and revocability

You should be able to answer: Who accessed what, when, why, from where, using which device—and what did they do? And you should be able to revoke access instantly.


Baseline Hardening in sshd_config (Low-Risk, High-Impact)

Start by making SSH safer without changing workflows.

Disable password auth (or phase it out)

Passwords are phishable and reused.

  • Target state: PasswordAuthentication no

  • Transition: restrict password auth to a bastion or limited group temporarily.

Disallow root SSH login

Require named accounts + privilege escalation.

  • PermitRootLogin no

Reduce attack surface

  • AllowUsers / AllowGroups to explicitly constrain who can log in

  • MaxAuthTries 3

  • LoginGraceTime 30

  • X11Forwarding no (unless truly needed)

  • AllowTcpForwarding no (enable only for specific roles)

  • PermitTunnel no (unless required)

Use modern cryptography

If you maintain older systems, align carefully, but aim for modern KEX/ciphers/MACs and disable legacy algorithms.


Key Management: Stop Treating Keys as Forever Credentials

Traditional SSH keys tend to live for years, get copied between laptops, and are rarely rotated. That’s the opposite of Zero Trust.

Use short-lived SSH certificates (preferred)

Instead of distributing public keys everywhere, you issue SSH certificates that expire (e.g., 8 hours).

  • Central authority signs user keys.

  • Servers trust the CA.

  • Revocation becomes manageable (short TTL + CA policy).

Operational win: You don’t have to chase keys on every server. You control access centrally.

If you must use authorized_keys, lock them down

At minimum:

  • Enforce key rotation (e.g., quarterly)

  • Ban shared keys

  • Ban copying prod keys to personal devices

  • Add from= restrictions when feasible

  • Use separate keys per environment (dev/stage/prod)


Identity-Aware Access: Tie SSH to Your SSO and MFA

SSH should not be the last holdout that bypasses MFA.

Options to achieve MFA + centralized policy

  • Identity-aware proxies / gateways for SSH

  • SSO-integrated access platforms

  • PAM modules and centralized authentication stacks

Goal: When a user leaves the company, access is gone instantly. No lingering keys.


Device Posture: Not All Laptops Are Equal

Zero Trust assumes compromise is possible—so you validate the client, not just the user.

Practical posture checks for SSH access

  • Corporate-managed device requirement for prod

  • Disk encryption enabled

  • EDR running

  • OS patch level within policy

  • MDM compliance state

Even if your SSH stack can’t enforce posture natively, you can enforce it at the access gateway/bastion layer.


Authorization: Don’t Grant Shell When You Only Need a Command

Many operational tasks don’t require full shell access.

Use role-based access patterns

  • Prod read-only role for logs/metrics checks

  • Deployment role limited to CI/CD runners or restricted commands

  • Break-glass role time-bound and heavily audited

Command restriction patterns

  • sudo with tight sudoers rules

  • ForceCommand for narrow workflows

  • Separate service accounts for automation with scoped permissions

Result: even if a credential leaks, the attacker doesn’t get free roam.


Session Controls: Recording, Auditing, and Alerting

Hardening isn’t only about preventing access—it’s also about detecting misuse.

Minimum viable auditability

  • Centralize SSH logs (auth + command where possible)

  • Forward to SIEM

  • Alert on:

    • new source IP / geo anomaly

    • unusual login times

    • first-time access to sensitive hosts

    • repeated failed logins / brute patterns

Session recording (for sensitive environments)

For prod and privileged roles, session recording can be a game-changer—especially in regulated environments.


Automation & CI/CD: Secure SSH Without Breaking Pipelines

Automation is often the reason teams avoid tightening SSH. The key is to treat automation identities properly.

Use distinct machine identities

  • Separate credentials per pipeline / per environment

  • Don’t reuse human keys for automation

Prefer ephemeral credentials for runners

  • Short-lived certs or tokens for CI jobs

  • Rotate secrets automatically

  • Restrict what the runner identity can do (commands/hosts/network)

Add guardrails

  • Only allow automation access from known runner networks

  • Require code review for changes affecting prod access workflows

  • Alert on automation identity used outside pipeline windows


A Rollout Plan That Won’t Cause Pager Fatigue

Phase 1: Baseline hardening (1–2 weeks)

  • Root login off

  • Passwords phased down

  • AllowGroups / allowlists

  • Logging centralized

Phase 2: Centralize identity and MFA (2–6 weeks)

  • SSO integration or gateway

  • Remove shared keys

  • Define roles (read-only / deploy / break-glass)

Phase 3: Ephemeral access + posture (1–3 months)

  • SSH certs with short TTL

  • Device compliance enforcement for prod

  • Session recording for privileged access

Phase 4: Continuous improvement

  • Access reviews

  • Automated key/credential lifecycle

  • Better detections and response playbooks


Common Pitfalls to Avoid

“We’ll just block SSH from the internet”

Good start, but not Zero Trust. Internal networks can be compromised.

“We’ll enforce MFA but keep permanent keys”

MFA helps at login time; permanent keys can still leak and live forever.

“We’ll lock it down later”

SSH is one of the highest-impact attack paths. Hardening is one of the best ROI security projects you can do.


Conclusion

Zero Trust SSH is not one product or one config. It’s a practical shift:

  • from static keys to short-lived credentials,

  • from network trust to identity + device trust,

  • from broad shell access to least privilege,

  • from “hope nothing happens” to auditable, revocable access.

You can start today with baseline sshd hardening and a clear rollout plan—then move to centralized identity, ephemeral access, and posture enforcement without disrupting operations.

Log Management Solution with Elasticsearch, Logstash, Kibana and Grafana

Log management solution for custom application

What I need it , How I did it;

Hello all ,

I would like to share a solution which I build for my application team’s software’s log management.

They came to me and told me, they were looking for a solution; Their applications creates custom logs and that logs store on Windows Machine drive. They need a tool for the monitor all different log files, when a specific error occurs (key word) they were requesting an email about it. Also they want to see the how many log creating in the system and need to see in graph visualization.

In Infrastructure team we have using many monitoring tools for that kind of purpose but, none of them can understand the unstructured log files, I mean application based log structure. Yes they can understand the windows events or Linux messages logs but this time it was different. This log files was unstructured for  our monitoring application tools.

So I have start to looking for a solution about it. After small search in the internet I have found the tool . It is Elasticsearch, Logstash and Kibana  known name with Elastic-Stack .

I have download the product installed on a test server. It was great , I was happy because I have stored the logs in elasticsearch, parsed with logstash, read and collected with filebeat. I could easily querying the logs with Kibana (Web interface) . Now it comes to create alarms for the error keywords . What  ?, How !  Elastic.co asking money for this. This options only available in non free versions of it.

Yes, I am working at a big corporate company but now on these days, Management is telling us find a free and opensource versions for software’s .  Even they have motto about it. 🙂

In other hand we had also lot’s of monitoring tools, for this purpose we could buy a license for the text monitoring addon. So I have to solve it Free and Open Source.

I couldn’t give up the elasticsearch, because it was so easy the configure and very easy to see the visualizations of the logs. I have start the digging the internet again.  Yes I have found an other solution for it;   Grafana

With this free and opensource tool, I got fancy graph and alerting system about my logs. Yes eureka…I have solved . Now I would like to show you step by step,  how to do that.

Installation Steps;

I have install a clean  Centos 7.6 on a test machine.  After it I have install the epel repo on that system.

  • sudo yum install epel-release
  • sudo yum update
  • sudo su -

Now I need to install the elastic repos for the elastic installations.

  • cd /etc/yum.repos.d/
  • vim elasticsearch.repo
[elasticsearch-7.x]
name=Elasticsearch repository for 7.x packages
baseurl=https://artifacts.elastic.co/packages/7.x/yum
gpgcheck=1
gpgkey=https://artifacts.elastic.co/GPG-KEY-elasticsearch
enabled=1
autorefresh=1
type=rpm-md
  • vim kibana.repo
[kibana-7.x]
name=Kibana repository for 7.x packages
baseurl=https://artifacts.elastic.co/packages/7.x/yum
gpgcheck=1
gpgkey=https://artifacts.elastic.co/GPG-KEY-elasticsearch
enabled=1
autorefresh=1
type=rpm-md
  • vim logstash.repo
[logstash-7.x]
name=Elastic repository for 7.x packages
baseurl=https://artifacts.elastic.co/packages/7.x/yum
gpgcheck=1
gpgkey=https://artifacts.elastic.co/GPG-KEY-elasticsearch
enabled=1
autorefresh=1
type=rpm-md
  • vim grafana.repo
[grafana]
name=grafana
baseurl=https://packages.grafana.com/oss/rpm
repo_gpgcheck=1
enabled=1
gpgcheck=1
gpgkey=https://packages.grafana.com/gpg.key
sslverify=1
sslcacert=/etc/pki/tls/certs/ca-bundle.crt

Elastic products needs OpenJDK to workout, for this purpose I decided to use Amazon Corretto 8 for the Open JDK

  • wget https://d3pxv6yz143wms.cloudfront.net/8.222.10.1/java-1.8.0-amazon-corretto-devel-1.8.0_222.b10-1.x86_64.rpm
  • yum install java-1.8.0-amazon-corretto-devel-1.8.0_222.b10-1.x86_64.rpm

Now I can install the all other tools.

  • yum install elasticsearch kibana logstash filebeat grafana nginx cifs-utils -y
systemctl start elasticsearch.service

systemctl enable elasticsearch.service

systemctl status elasticsearch.service


systemctl enable kibana

systemctl start kibana

systemctl status kibana

All elastic products are listening localhost (127.0.0.1)

  • cd /etc/nginx/conf.d
  • vim serverhostname.conf
server {
listen 80;

server_name servername.serverdomain.local;

auth_basic "Restricted Access";
auth_basic_user_file /etc/nginx/htpasswd.users;

location / {
proxy_pass http://localhost:5601;
proxy_http_version 1.1;
proxy_set_header Upgrade $http_upgrade;
proxy_set_header Connection 'upgrade';
proxy_set_header Host $host;
proxy_cache_bypass $http_upgrade;
  }
}

On my system I have used the nginx as revers proxy and basic password authentication for the basic web site security.

I need to edit /etc/nginx/htpasswd.users file for the encrypted user and password info.

I have created the file via this web site for my users. You can use your own choices.

  • cd /etc/nginx/
  • vim htpasswd.users
admin:$apr1$1bdToKFy$0KYSsCviSpvcCzN9w1km.0
  • systemctl enable nginx
    
    systemctl start nginx
    
    systemctl status nginx

My private test server also in my private network so, decided not to use local firewall and selinux policies.

  • systemctl stop firewalld
    
    systemctl disable firewalld
    
    systemctl status firewalld
  • vim /etc/selinux/config
# This file controls the state of SELinux on the system.
# SELINUX= can take one of these three values:
# enforcing - SELinux security policy is enforced.
# permissive - SELinux prints warnings instead of enforcing.
# disabled - No SELinux policy is loaded.
SELINUX=disabled
# SELINUXTYPE= can take one of three values:
# targeted - Targeted processes are protected,
# minimum - Modification of targeted policy. Only selected processes are protected.
# mls - Multi Level Security protection.
SELINUXTYPE=targeted
  • reboot

On my system logs file storing on a windows server local disk. I need a find a way to access on that therefor  I have decided to mount the smb share on my local system.

  • vim /root/share_smb_creds
username=log_user
password=SecurePassword
  • useradd -u 5000 log_user
    
  • groupadd -g 6000 logs
usermod -G logs -a log_user
usermod -G logs -a kibana
usermod -G logs -a elasticsearch
usermod -G logs -a logstash
vim /etc/fstab
\\\\s152a0000246\\c$\\App_Log_Files /mnt/logs cifs credentials=/root/share_smb_creds,uid=5000,gid=6000 0 0


reboot

The point about the all elasticsearch products configuration files are YAML formated  so please you need to be careful about the conf format and yml files formats.

  • cd /etc/logstash/conf.d
  • vim 02-beats-input.conf
input {
beats {
port => 5044
   }
}
  • vim 30-elasticsearch-output.conf
output {
elasticsearch {
hosts => ["localhost:9200"]
manage_template => false
index => "%{[@metadata][beat]}-%{[@metadata][version]}-%{+YYYY.MM.dd}"
   }
}
  • systemctl enable logstash
  • systemctl start logstash
  • systemctl status logstash
  • vim /etc/filebeat/filebeat.yml
filebeat.inputs:
- type: log
paths:
- /mnt/logs/*.txt


output.logstash:
hosts: ["localhost:5044"]
systemctl enable filebeat
systemctl start filebeat 
systemctl status filebeat -l

If every things success you can connect to kibana web interface and you can able to manage your elasticsearch system.

Kibana ports is listening localhost:5601 but what we have done; setup the nginx for the revers proxy. When connection comes to nginx , nginx will ask a username and password, if you pass it success, you connection will forward it to kibana.

Off course you need to research about the graphs and visualizations, these are only basic movements.

Now on we can run the Grafana.

systemctl enable grafana-server
systemctl start grafana-server
systemctl status grafana-server

You can connect to grafana with your browser http://servername:3000

When you connect to your grafana gui , you will see a welcome page. First you need to add a data source for Grafana usage.

I have installed the latest version of elastic.co product so, I have choice the version 7+ , as a index name you can use “filebeat*” Save and test the configuration, if you success now you can able to see the logs and metric information on grafana too. 🙂

At the logs tab in the explore section , if you get an error like “Unkown elastic error response” That means elasticsearch sends big data to grafana , and grafana couldn’t understand it. You need to give small your time line to see logs in grafana. If you investigate the logs detailed , you have to use KIBANA.

Now it is time to search logs for errors and make an alert for your application team.

My application team gave me the error key words for the logs, so I know what should I search 🙂

Lest take an example ; My error log key word is “WRNDBSLOGDEF0000000002” so when I found that keyword in the last 15 mins logs, I need to send an email to application team.

First things first; Lets search it in the logs with Kibana;

As you can see in my example , error comes to and kibana in search results.

You need to define the alerts contacts information at  grafana notification channel.

Now we need to create an alert on grafana about it.  Please check my screen shots about it. You can see the details and step by step how to do that.

Grafana alert system settings is OK. But we have last settings as grafana system configuration , which is how to send the email via SMTP server.

vim /etc/garafana/grafana.ini
[smtp]
enabled = true
host = smtpserver.domain.com
;user =
# If the password contains # or ; you have to wrap it with trippel quotes. Ex """#password;"""
;password =
;cert_file =
;key_file =
skip_verify = true
from_address = [email protected]
from_name = Grafana Alert
# EHLO identity in SMTP dialog (defaults to instance_name)
;ehlo_identity = domain.com

[emails]
welcome_email_on_sign_up = true

That’s it !!!

I am using this system about a month . My application teams are happy about it. Still I am improving it.

I will share the new updates at my future posts.

I hope it is also useful for you too.

If you have any further questions about and any suggestions. Please write comments in this post.