Log management solution for custom application
What I need it , How I did it;
Hello all ,
I would like to share a solution which I build for my application team’s software’s log management.
They came to me and told me, they were looking for a solution; Their applications creates custom logs and that logs store on Windows Machine drive. They need a tool for the monitor all different log files, when a specific error occurs (key word) they were requesting an email about it. Also they want to see the how many log creating in the system and need to see in graph visualization.
In Infrastructure team we have using many monitoring tools for that kind of purpose but, none of them can understand the unstructured log files, I mean application based log structure. Yes they can understand the windows events or Linux messages logs but this time it was different. This log files was unstructured for our monitoring application tools.
So I have start to looking for a solution about it. After small search in the internet I have found the tool . It is Elasticsearch, Logstash and Kibana known name with Elastic-Stack .
I have download the product installed on a test server. It was great , I was happy because I have stored the logs in elasticsearch, parsed with logstash, read and collected with filebeat. I could easily querying the logs with Kibana (Web interface) . Now it comes to create alarms for the error keywords . What ?, How ! Elastic.co asking money for this. This options only available in non free versions of it.
Yes, I am working at a big corporate company but now on these days, Management is telling us find a free and opensource versions for software’s . Even they have motto about it. 🙂
In other hand we had also lot’s of monitoring tools, for this purpose we could buy a license for the text monitoring addon. So I have to solve it Free and Open Source.
I couldn’t give up the elasticsearch, because it was so easy the configure and very easy to see the visualizations of the logs. I have start the digging the internet again. Yes I have found an other solution for it; Grafana
With this free and opensource tool, I got fancy graph and alerting system about my logs. Yes eureka…I have solved . Now I would like to show you step by step, how to do that.
Installation Steps;
I have install a clean Centos 7.6 on a test machine. After it I have install the epel repo on that system.
-
sudo yum install epel-release
-
sudo yum update
-
sudo su -
Now I need to install the elastic repos for the elastic installations.
-
cd /etc/yum.repos.d/
-
vim elasticsearch.repo
[elasticsearch-7.x]
name=Elasticsearch repository for 7.x packages
baseurl=https://artifacts.elastic.co/packages/7.x/yum
gpgcheck=1
gpgkey=https://artifacts.elastic.co/GPG-KEY-elasticsearch
enabled=1
autorefresh=1
type=rpm-md
-
vim kibana.repo
[kibana-7.x]
name=Kibana repository for 7.x packages
baseurl=https://artifacts.elastic.co/packages/7.x/yum
gpgcheck=1
gpgkey=https://artifacts.elastic.co/GPG-KEY-elasticsearch
enabled=1
autorefresh=1
type=rpm-md
-
vim logstash.repo
[logstash-7.x]
name=Elastic repository for 7.x packages
baseurl=https://artifacts.elastic.co/packages/7.x/yum
gpgcheck=1
gpgkey=https://artifacts.elastic.co/GPG-KEY-elasticsearch
enabled=1
autorefresh=1
type=rpm-md
-
vim grafana.repo
[grafana]
name=grafana
baseurl=https://packages.grafana.com/oss/rpm
repo_gpgcheck=1
enabled=1
gpgcheck=1
gpgkey=https://packages.grafana.com/gpg.key
sslverify=1
sslcacert=/etc/pki/tls/certs/ca-bundle.crt
Elastic products needs OpenJDK to workout, for this purpose I decided to use Amazon Corretto 8 for the Open JDK
-
wget https://d3pxv6yz143wms.cloudfront.net/8.222.10.1/java-1.8.0-amazon-corretto-devel-1.8.0_222.b10-1.x86_64.rpm
-
yum install java-1.8.0-amazon-corretto-devel-1.8.0_222.b10-1.x86_64.rpm
Now I can install the all other tools.
-
yum install elasticsearch kibana logstash filebeat grafana nginx cifs-utils -y
systemctl start elasticsearch.service

systemctl enable elasticsearch.service

systemctl status elasticsearch.service


systemctl enable kibana

systemctl start kibana

systemctl status kibana
All elastic products are listening localhost (127.0.0.1)
-
cd /etc/nginx/conf.d
-
vim serverhostname.conf
server {
listen 80;

server_name servername.serverdomain.local;

auth_basic "Restricted Access";
auth_basic_user_file /etc/nginx/htpasswd.users;

location / {
proxy_pass http://localhost:5601;
proxy_http_version 1.1;
proxy_set_header Upgrade $http_upgrade;
proxy_set_header Connection 'upgrade';
proxy_set_header Host $host;
proxy_cache_bypass $http_upgrade;
  }
}
On my system I have used the nginx as revers proxy and basic password authentication for the basic web site security.
I need to edit /etc/nginx/htpasswd.users file for the encrypted user and password info.
I have created the file via this web site for my users. You can use your own choices.
-
cd /etc/nginx/
-
vim htpasswd.users
admin:$apr1$1bdToKFy$0KYSsCviSpvcCzN9w1km.0
-
systemctl enable nginx

systemctl start nginx

systemctl status nginx
My private test server also in my private network so, decided not to use local firewall and selinux policies.
-
systemctl stop firewalld

systemctl disable firewalld

systemctl status firewalld
-
vim /etc/selinux/config
# This file controls the state of SELinux on the system.
# SELINUX= can take one of these three values:
# enforcing - SELinux security policy is enforced.
# permissive - SELinux prints warnings instead of enforcing.
# disabled - No SELinux policy is loaded.
SELINUX=disabled
# SELINUXTYPE= can take one of three values:
# targeted - Targeted processes are protected,
# minimum - Modification of targeted policy. Only selected processes are protected.
# mls - Multi Level Security protection.
SELINUXTYPE=targeted
-
reboot
On my system logs file storing on a windows server local disk. I need a find a way to access on that therefor I have decided to mount the smb share on my local system.
-
vim /root/share_smb_creds
username=log_user
password=SecurePassword
-
useradd -u 5000 log_user
-
groupadd -g 6000 logs
usermod -G logs -a log_user
usermod -G logs -a kibana
usermod -G logs -a elasticsearch
usermod -G logs -a logstash
vim /etc/fstab
\\\\s152a0000246\\c$\\App_Log_Files /mnt/logs cifs credentials=/root/share_smb_creds,uid=5000,gid=6000 0 0
reboot
The point about the all elasticsearch products configuration files are YAML formated so please you need to be careful about the conf format and yml files formats.
-
cd /etc/logstash/conf.d
-
vim 02-beats-input.conf
input {
beats {
port => 5044
   }
}
-
vim 30-elasticsearch-output.conf
output {
elasticsearch {
hosts => ["localhost:9200"]
manage_template => false
index => "%{[@metadata][beat]}-%{[@metadata][version]}-%{+YYYY.MM.dd}"
   }
}
-
systemctl enable logstash
-
systemctl start logstash
-
systemctl status logstash
-
vim /etc/filebeat/filebeat.yml
filebeat.inputs:
- type: log
paths:
- /mnt/logs/*.txt


output.logstash:
hosts: ["localhost:5044"]
systemctl enable filebeat
systemctl start filebeat
systemctl status filebeat -l
If every things success you can connect to kibana web interface and you can able to manage your elasticsearch system.
Kibana ports is listening localhost:5601 but what we have done; setup the nginx for the revers proxy. When connection comes to nginx , nginx will ask a username and password, if you pass it success, you connection will forward it to kibana.
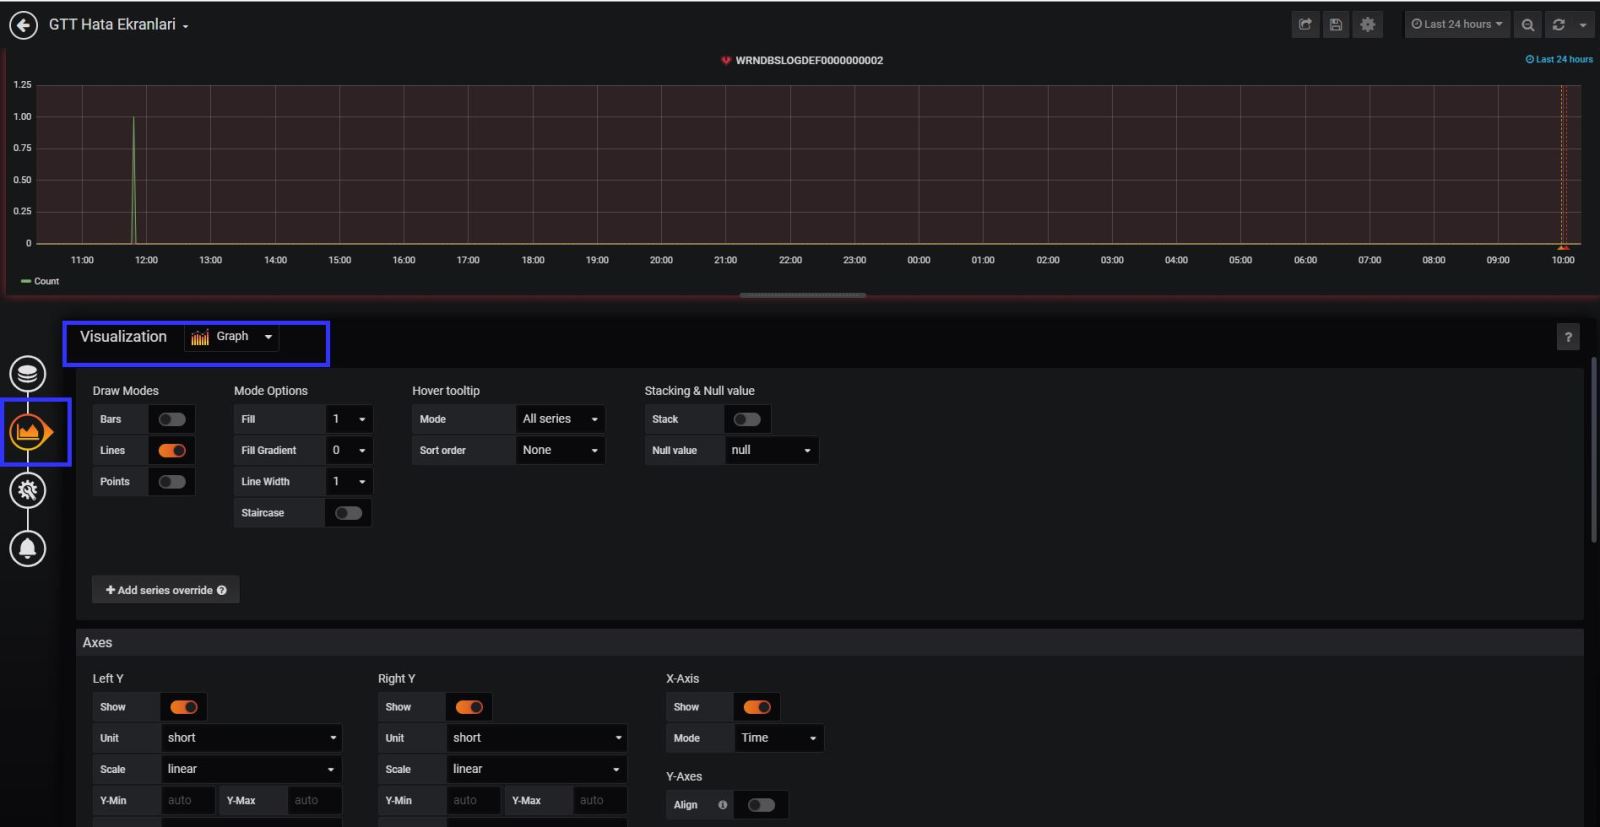
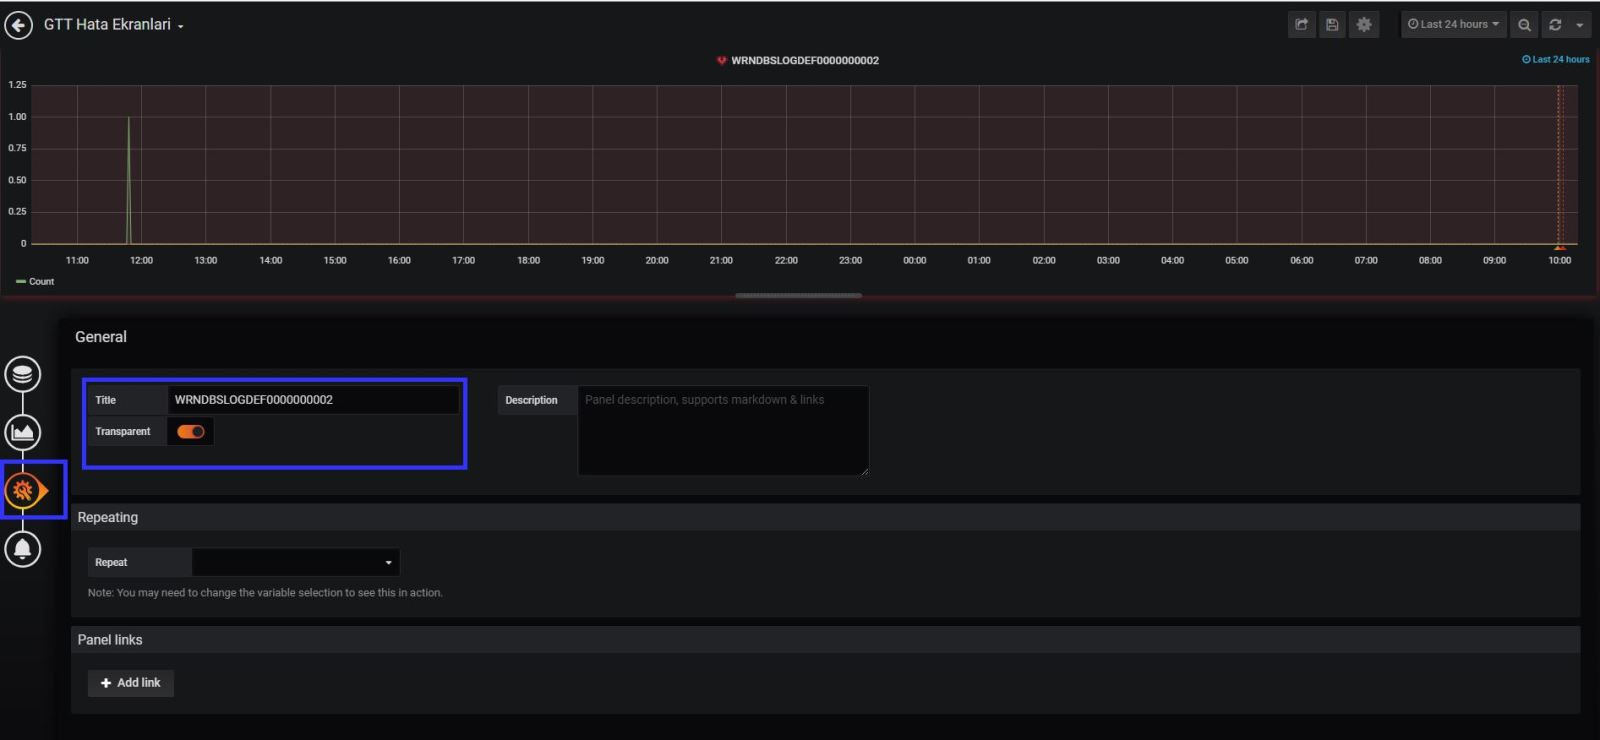
Off course you need to research about the graphs and visualizations, these are only basic movements.
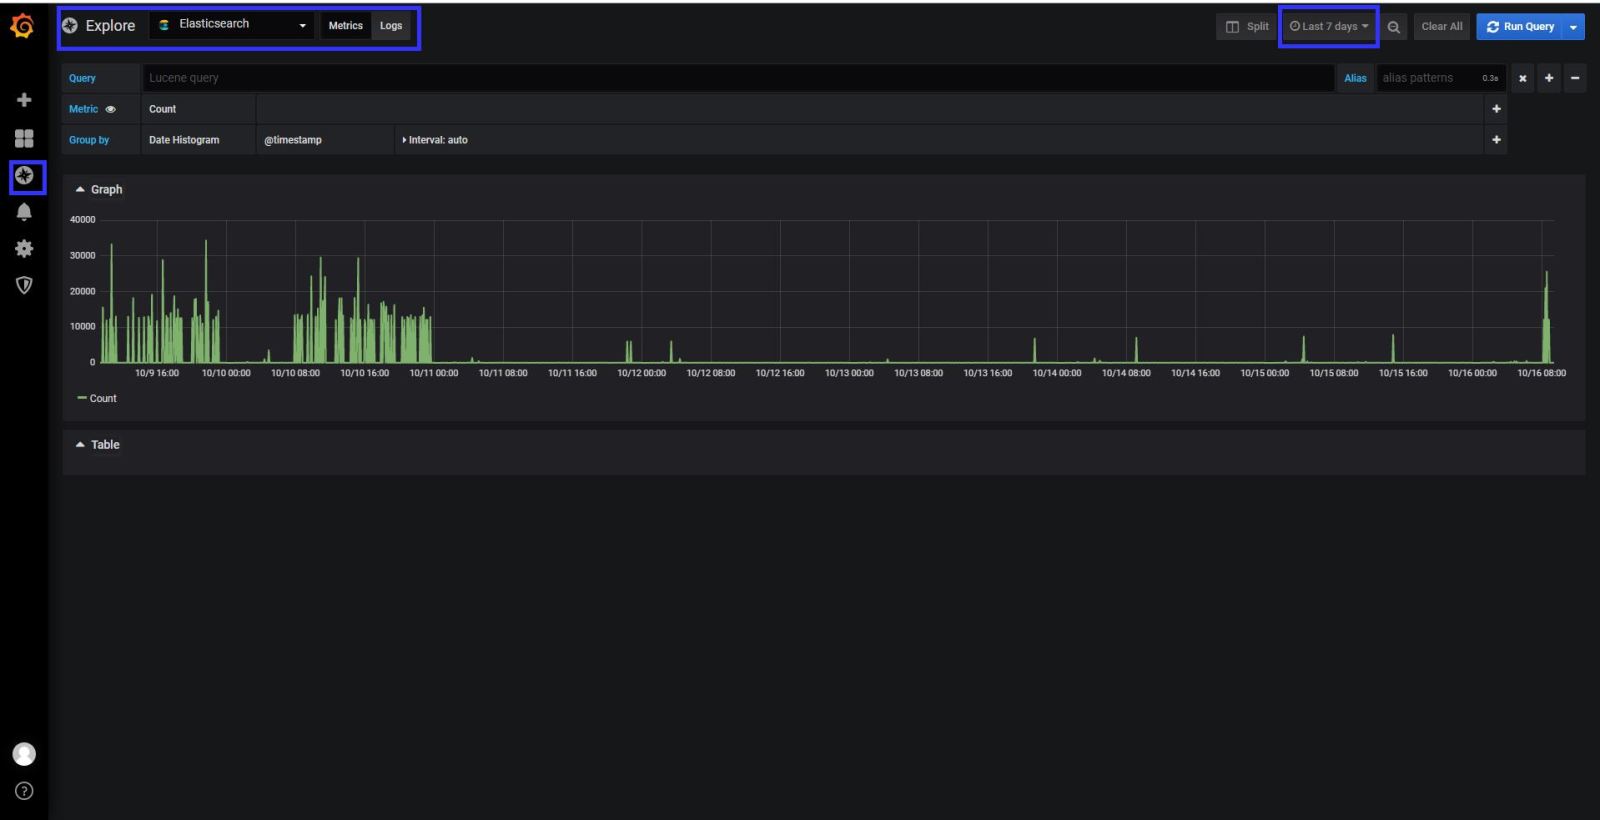
Now on we can run the Grafana.
systemctl enable grafana-server
systemctl start grafana-server
systemctl status grafana-server
You can connect to grafana with your browser http://servername:3000
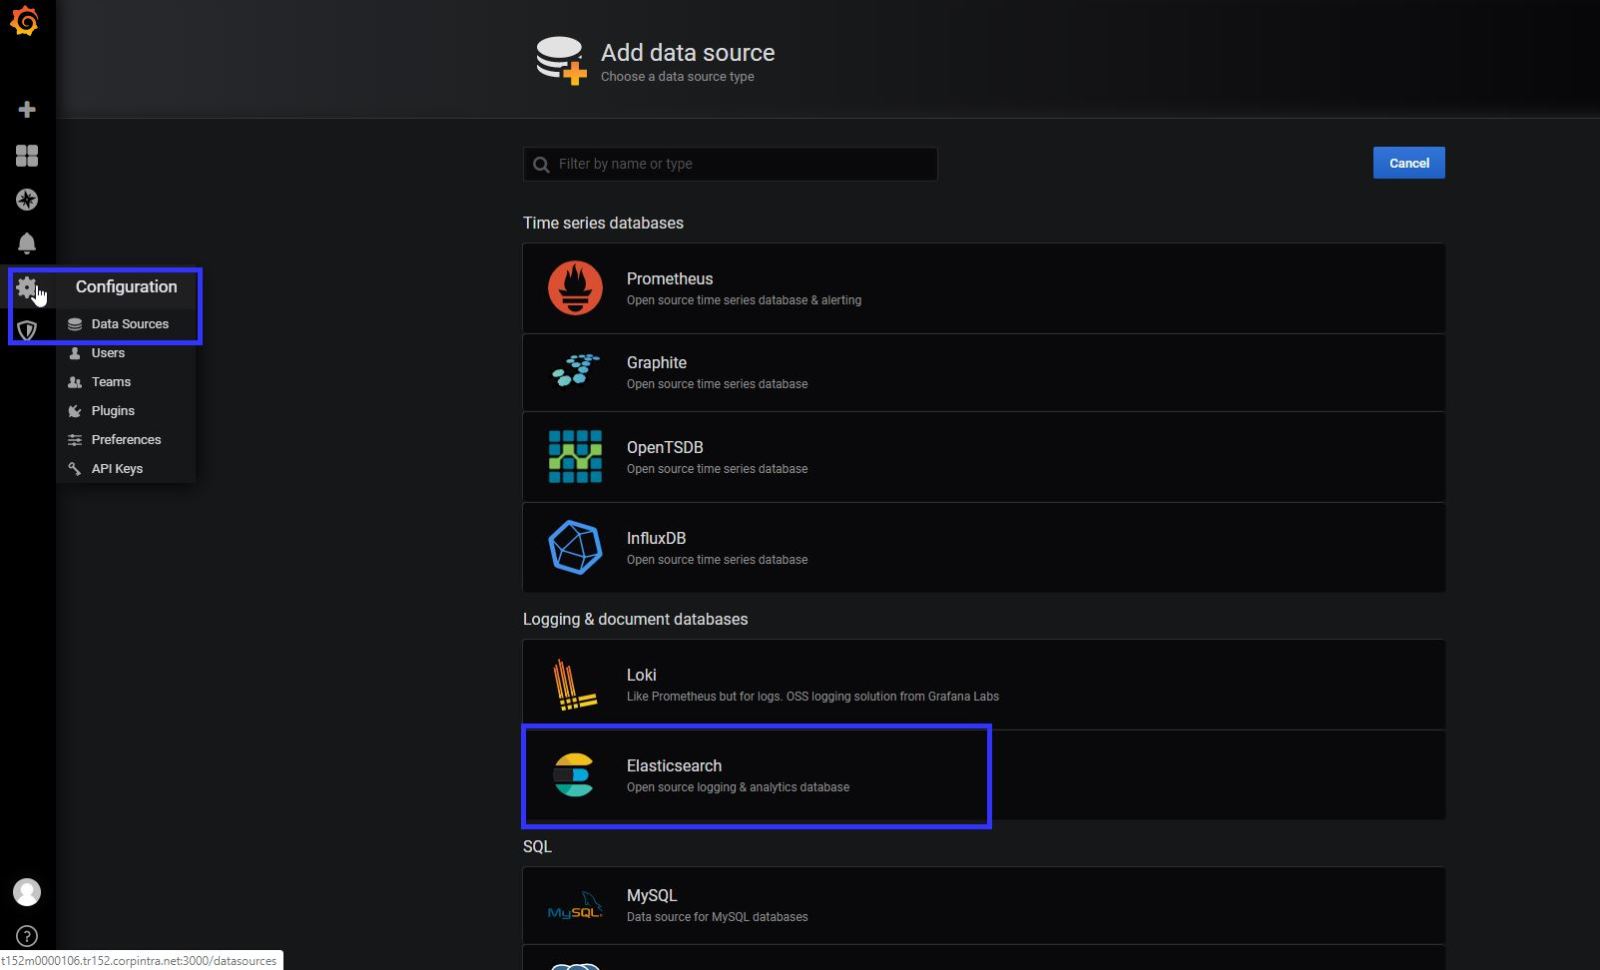
When you connect to your grafana gui , you will see a welcome page. First you need to add a data source for Grafana usage.
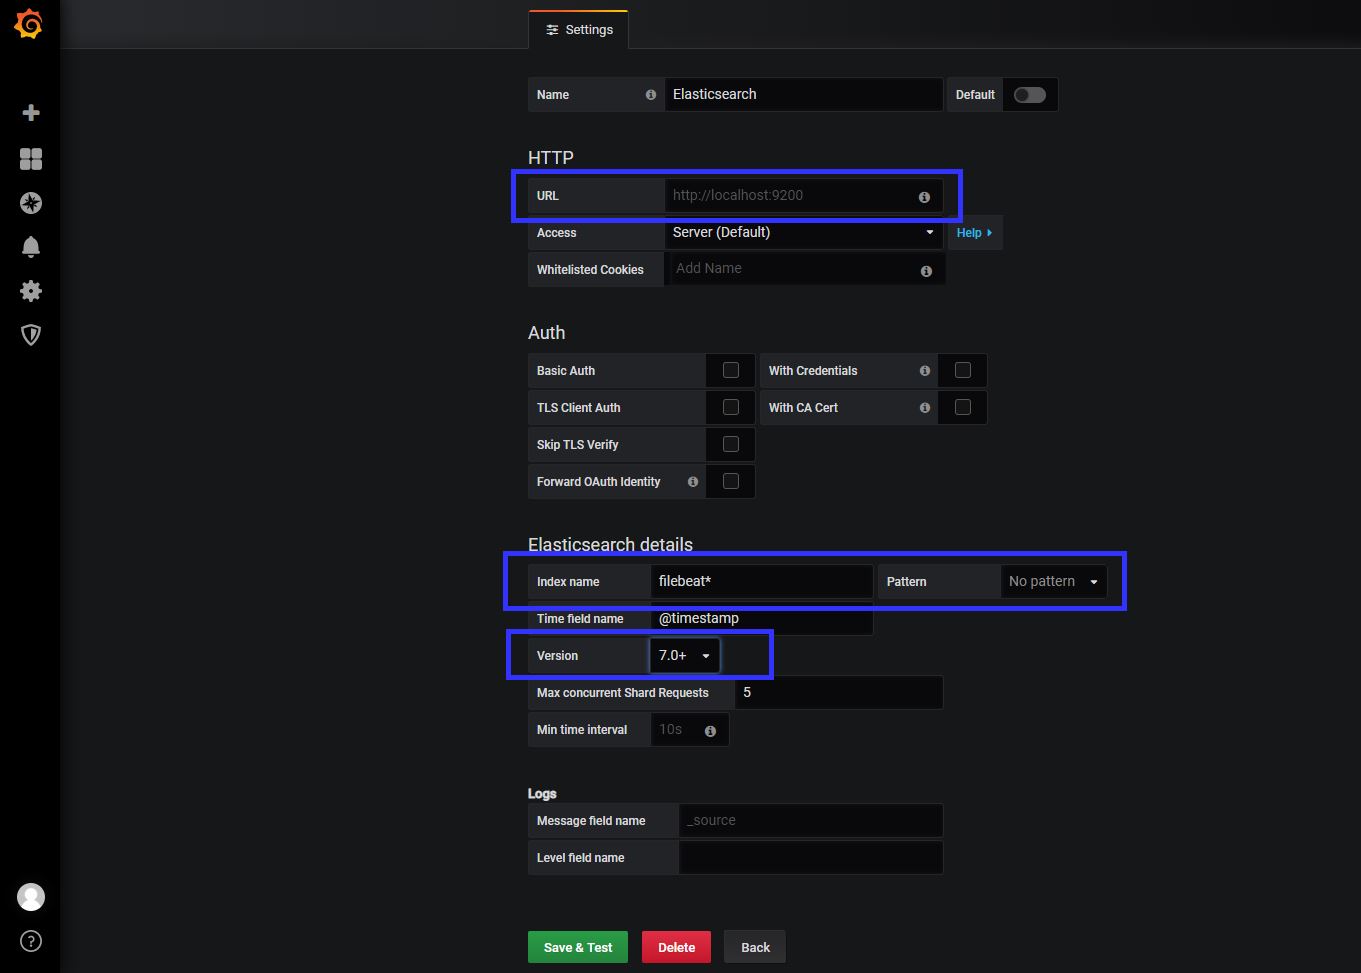
I have installed the latest version of elastic.co product so, I have choice the version 7+ , as a index name you can use “filebeat*” Save and test the configuration, if you success now you can able to see the logs and metric information on grafana too. 🙂
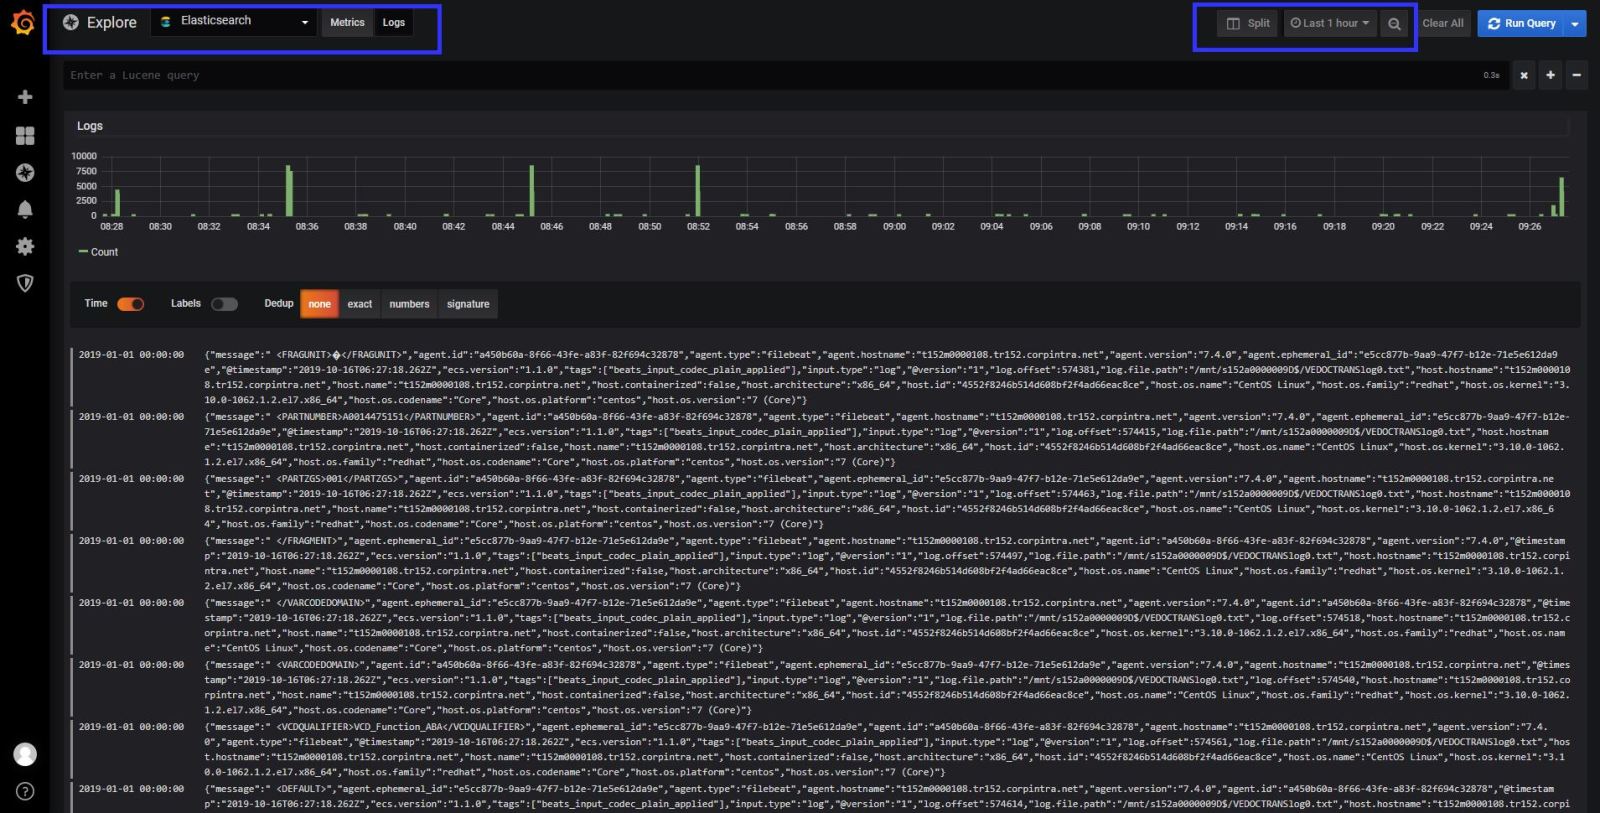
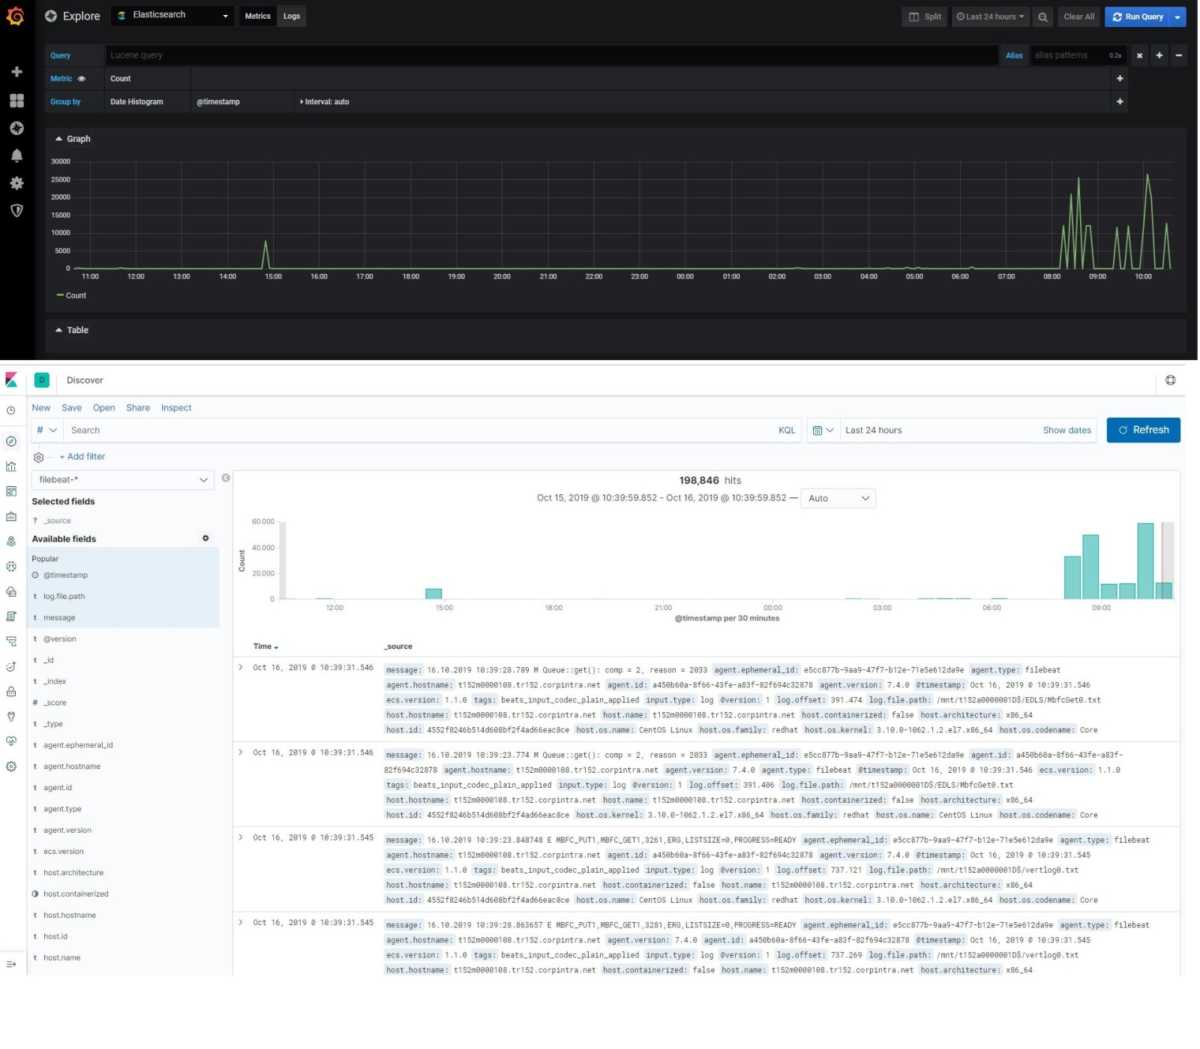
At the logs tab in the explore section , if you get an error like “Unkown elastic error response” That means elasticsearch sends big data to grafana , and grafana couldn’t understand it. You need to give small your time line to see logs in grafana. If you investigate the logs detailed , you have to use KIBANA.

Now it is time to search logs for errors and make an alert for your application team.
My application team gave me the error key words for the logs, so I know what should I search 🙂
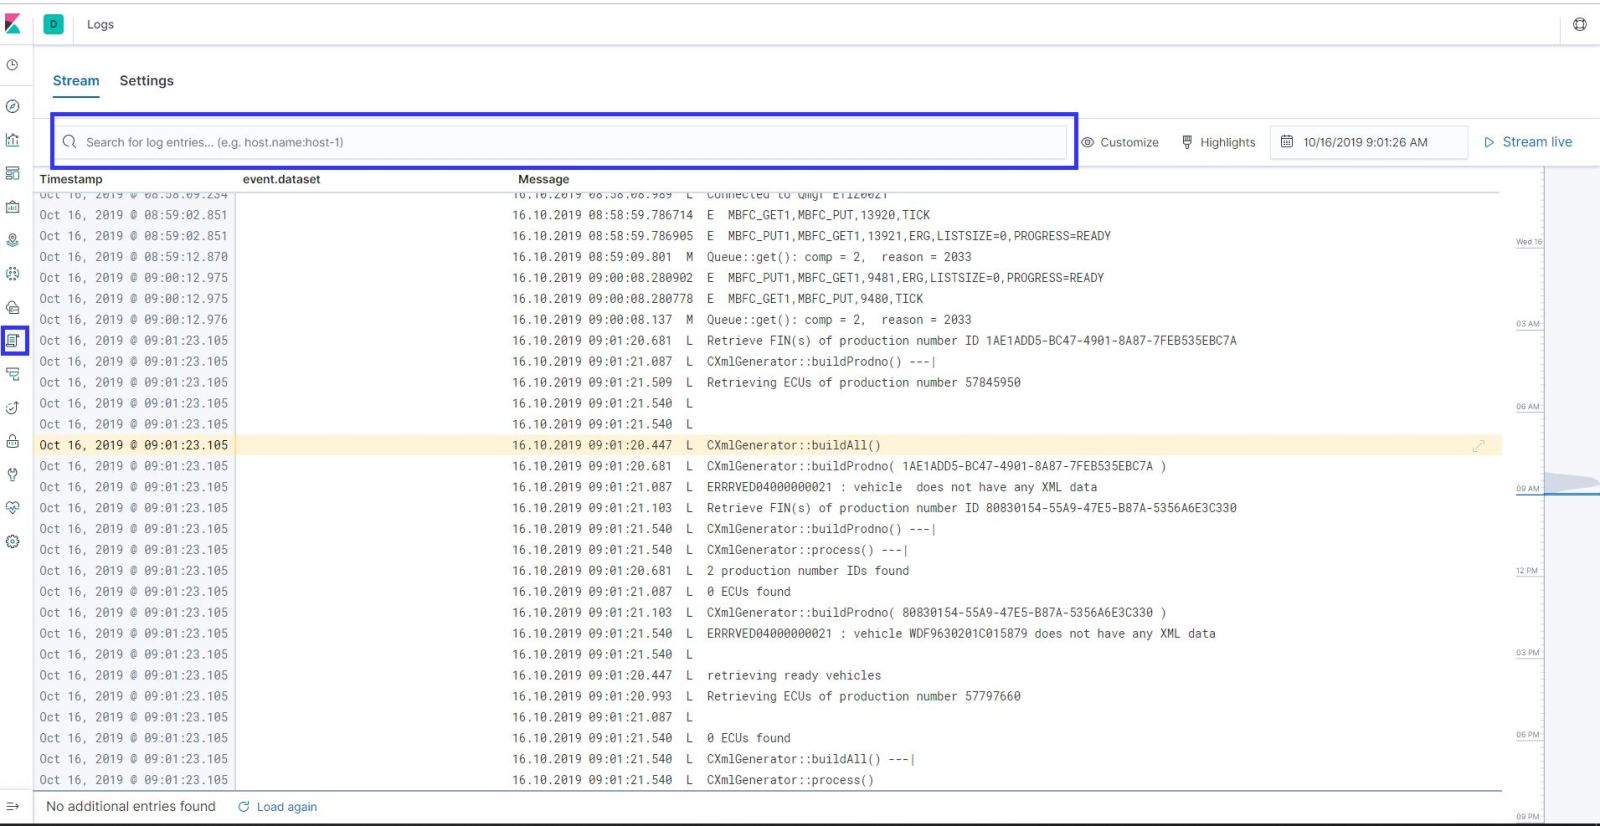
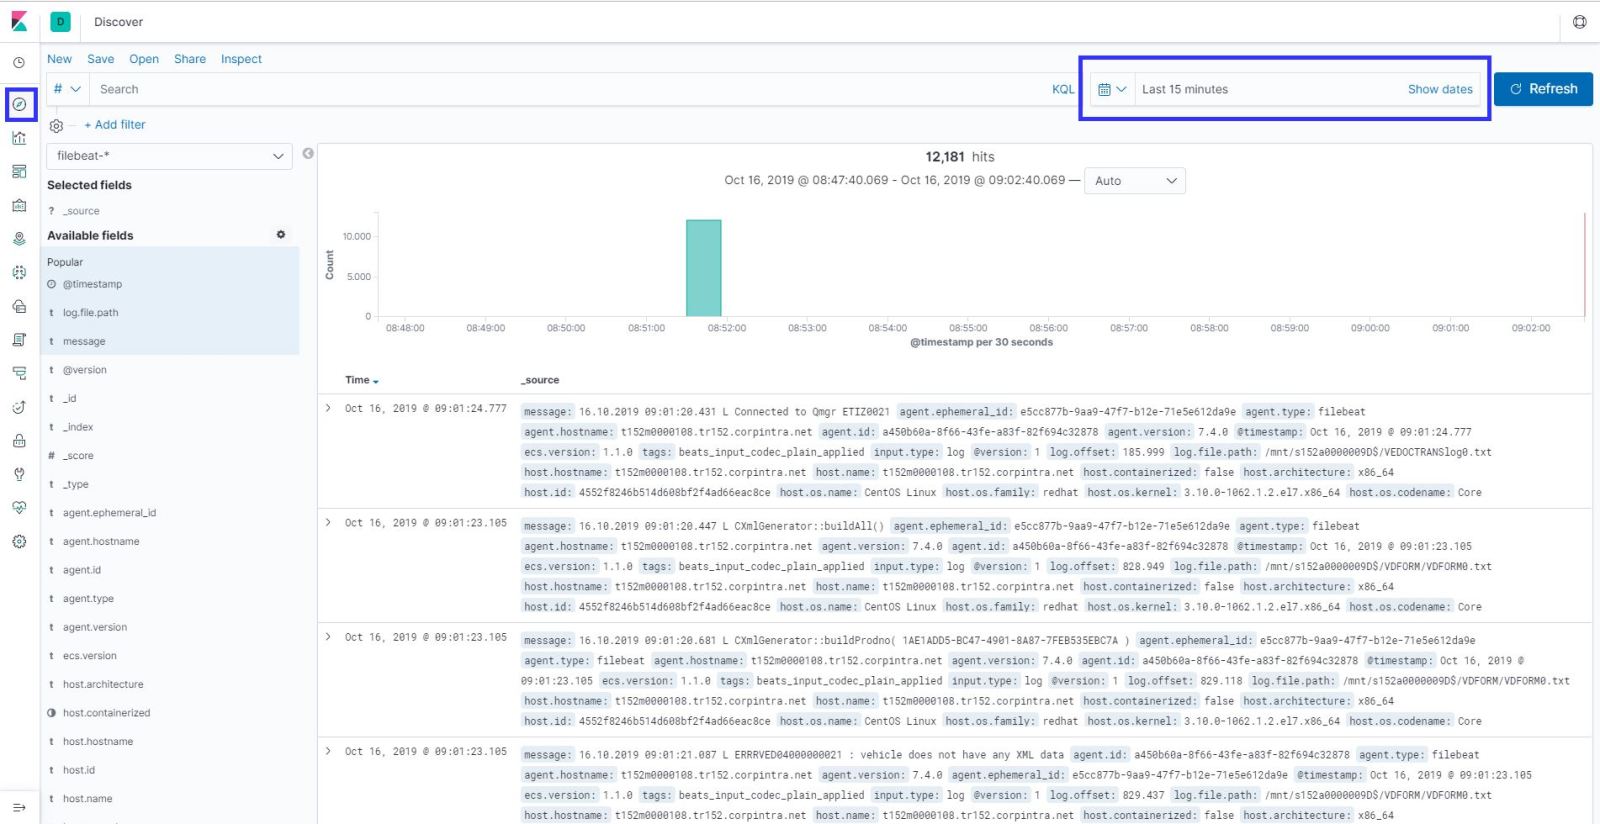
Lest take an example ; My error log key word is “WRNDBSLOGDEF0000000002” so when I found that keyword in the last 15 mins logs, I need to send an email to application team.
First things first; Lets search it in the logs with Kibana;
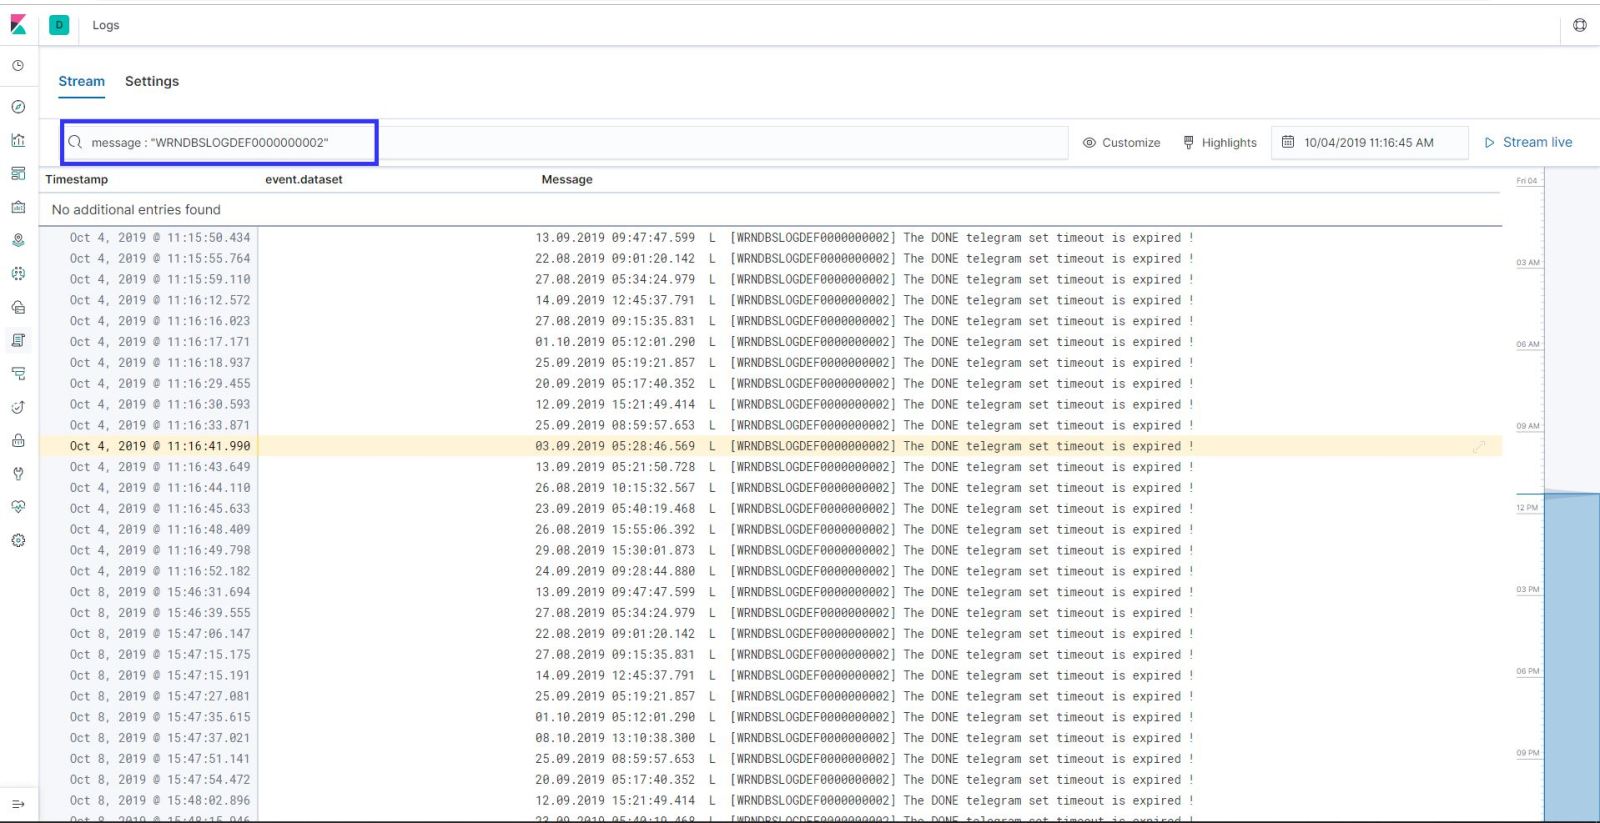
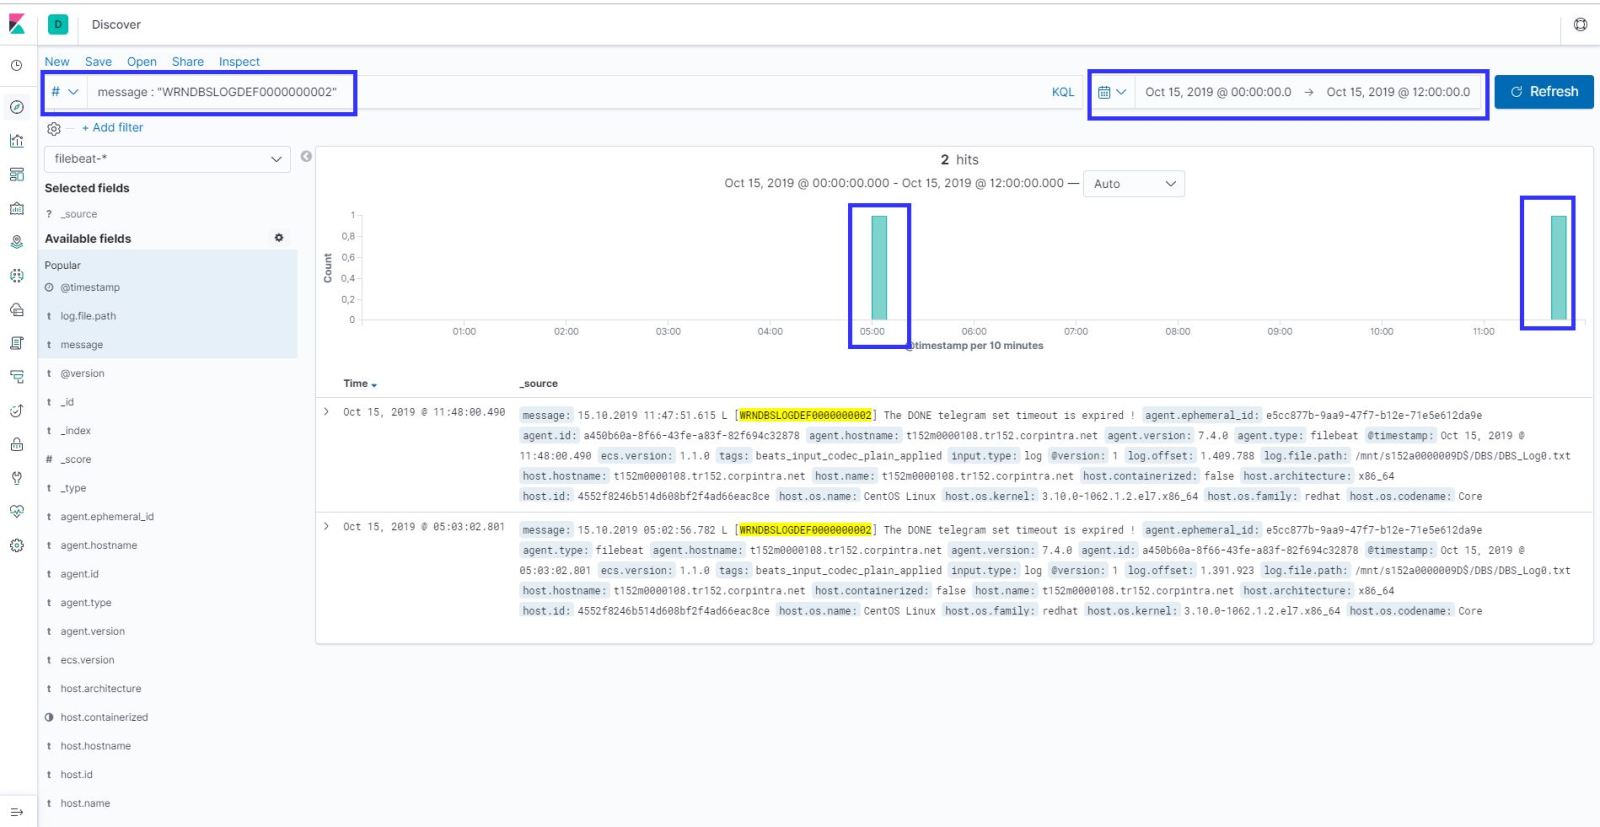
As you can see in my example , error comes to and kibana in search results.
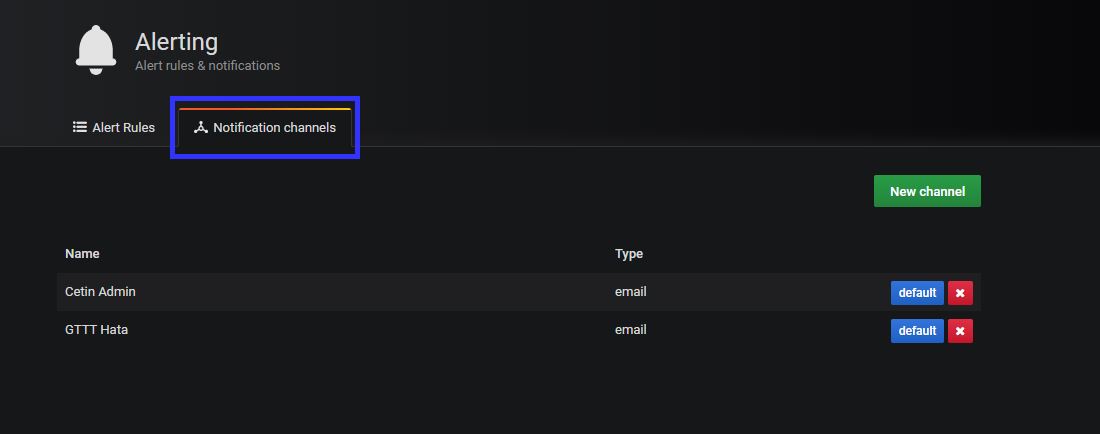
You need to define the alerts contacts information at grafana notification channel.
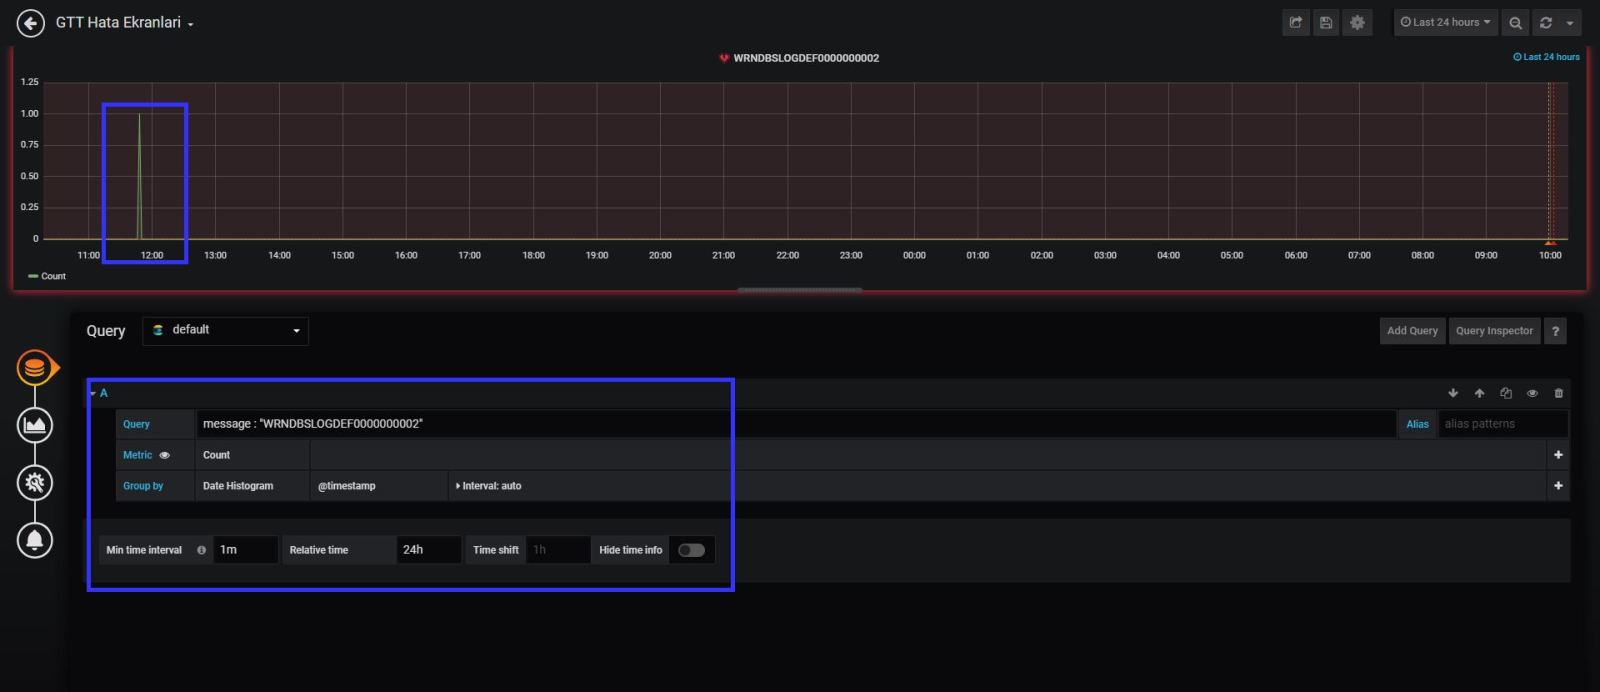
Now we need to create an alert on grafana about it. Please check my screen shots about it. You can see the details and step by step how to do that.
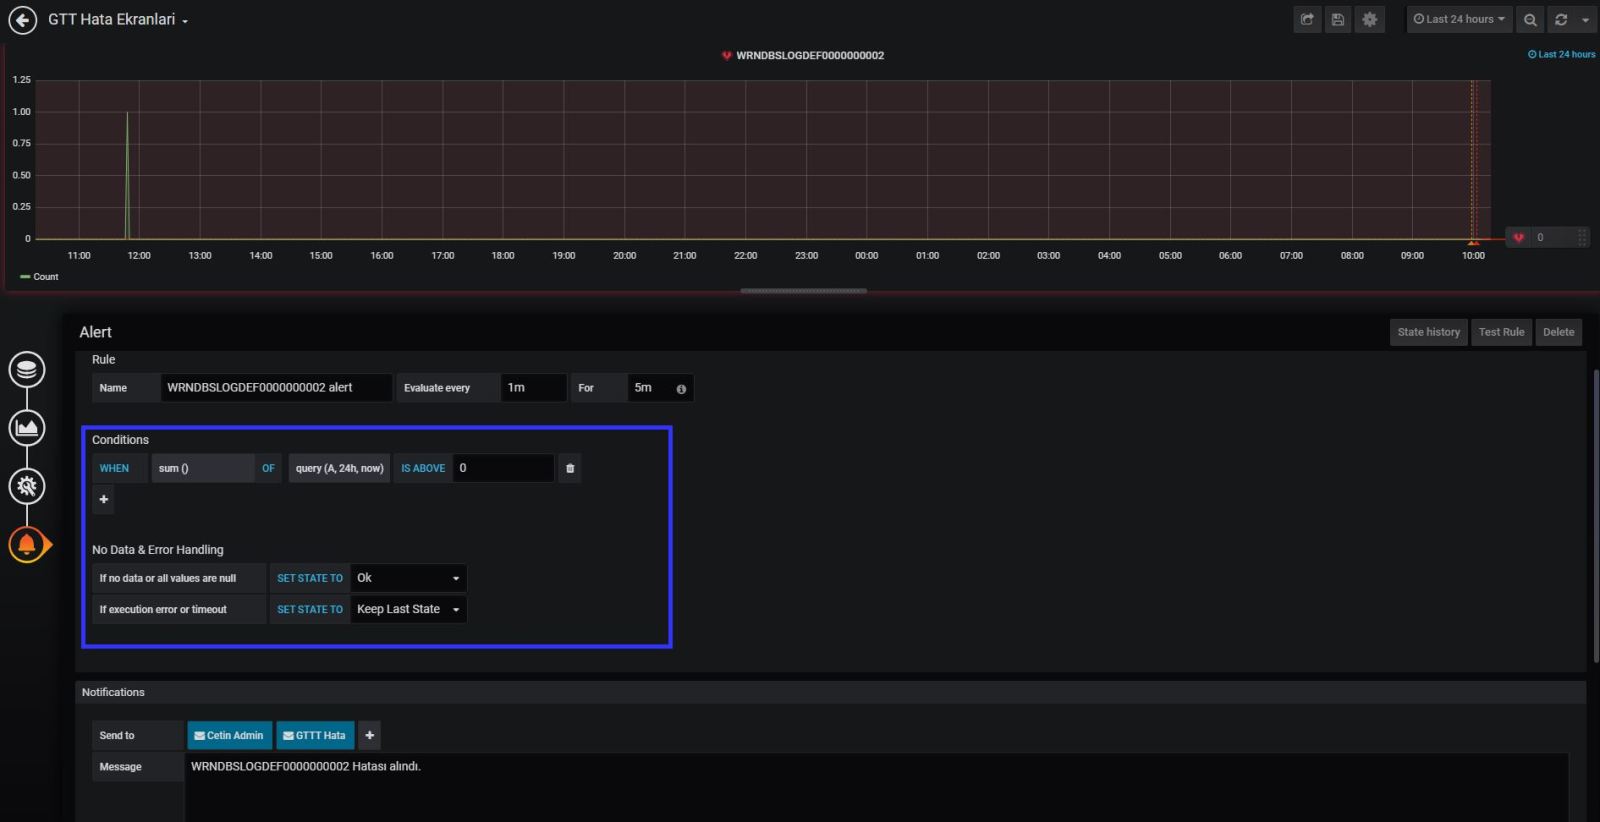
Grafana alert system settings is OK. But we have last settings as grafana system configuration , which is how to send the email via SMTP server.
vim /etc/garafana/grafana.ini
[smtp]
enabled = true
host = smtpserver.domain.com
;user =
# If the password contains # or ; you have to wrap it with trippel quotes. Ex """#password;"""
;password =
;cert_file =
;key_file =
skip_verify = true
from_address = [email protected]
from_name = Grafana Alert
# EHLO identity in SMTP dialog (defaults to instance_name)
;ehlo_identity = domain.com

[emails]
welcome_email_on_sign_up = true
That’s it !!!
I am using this system about a month . My application teams are happy about it. Still I am improving it.
I will share the new updates at my future posts.
I hope it is also useful for you too.
If you have any further questions about and any suggestions. Please write comments in this post.